We Create Unbeatable
Trading Indicators
Start with our premium Malaysian SNR & Gann Swing Chart for TradingView – the ultimate tools for precise Support & Resistance Levels and Trend analysis.
Malaysian SNR Levels
Turn Key Levels Into Profitable Setups
Stop wasting time manually drawing support and resistance. The Malaysian SNR Levels indicator does it all for you — instantly detecting the most important key levels on any chart and timeframe.
Whether you trade breakouts, rejections, or pullbacks, this tool gives you the critical zones you need to plan precise entries and maximize your win rate.
- Instantly identifies high-probability support & resistance zones
- Works on all markets and timeframes
- Perfect for day traders, swing traders, and scalpers
- Save hours of chart work and boost your trading accuracy
99€
Gann Swing Chart

See the Market’s True Structure – Before Everyone Else
The Gann Swing Chart is your edge in identifying market structure, trend reversals, and turning points before they’re obvious to the crowd.
By mapping price swings with precision, it reveals momentum shifts and potential trade setups with unmatched clarity.
No more guessing — understand what price is doing and trade in sync with the real flow of the market.
- Spot trend changes early and ride big moves from the start
- Visualize structure clearly and plan perfect entries
- Combines seamlessly with any strategy or indicator
- Gain the confidence to trade with logic, not emotion
79€
BUNDLE - MSNR, Gann Swing Chart, Daily Direction Profile

The Malaysian SNR + Gann Swing + Daily Direction Profile Bundle combines three powerful trading tools into one complete market structure package.
Designed for traders who focus on precision entries, directional bias, and high-probability support & resistance reactions.
This bundle helps you identify:
- Key support & resistance levels
- Market swing direction and trend structure
- Daily directional bias and profile-based reactions
- High-probability reversal and continuation zones
Key advantages:
- Malaysian SNR provides precise support & resistance levels
- Gann Swing helps identify market structure shifts and trend direction
- Daily Direction Profile gives a clear overview of bullish or bearish daily bias
- Works across Forex, Crypto, Indices, and Commodities
- Timeframe-independent analysis for cleaner decision making
- Combines structure, direction, and context into one workflow
- Reduces chart clutter while improving trade confidence
- Saves hours of manual market analysis
Perfect for traders looking for a complete discretionary trading framework based on structure, direction, and price behavior.
159€
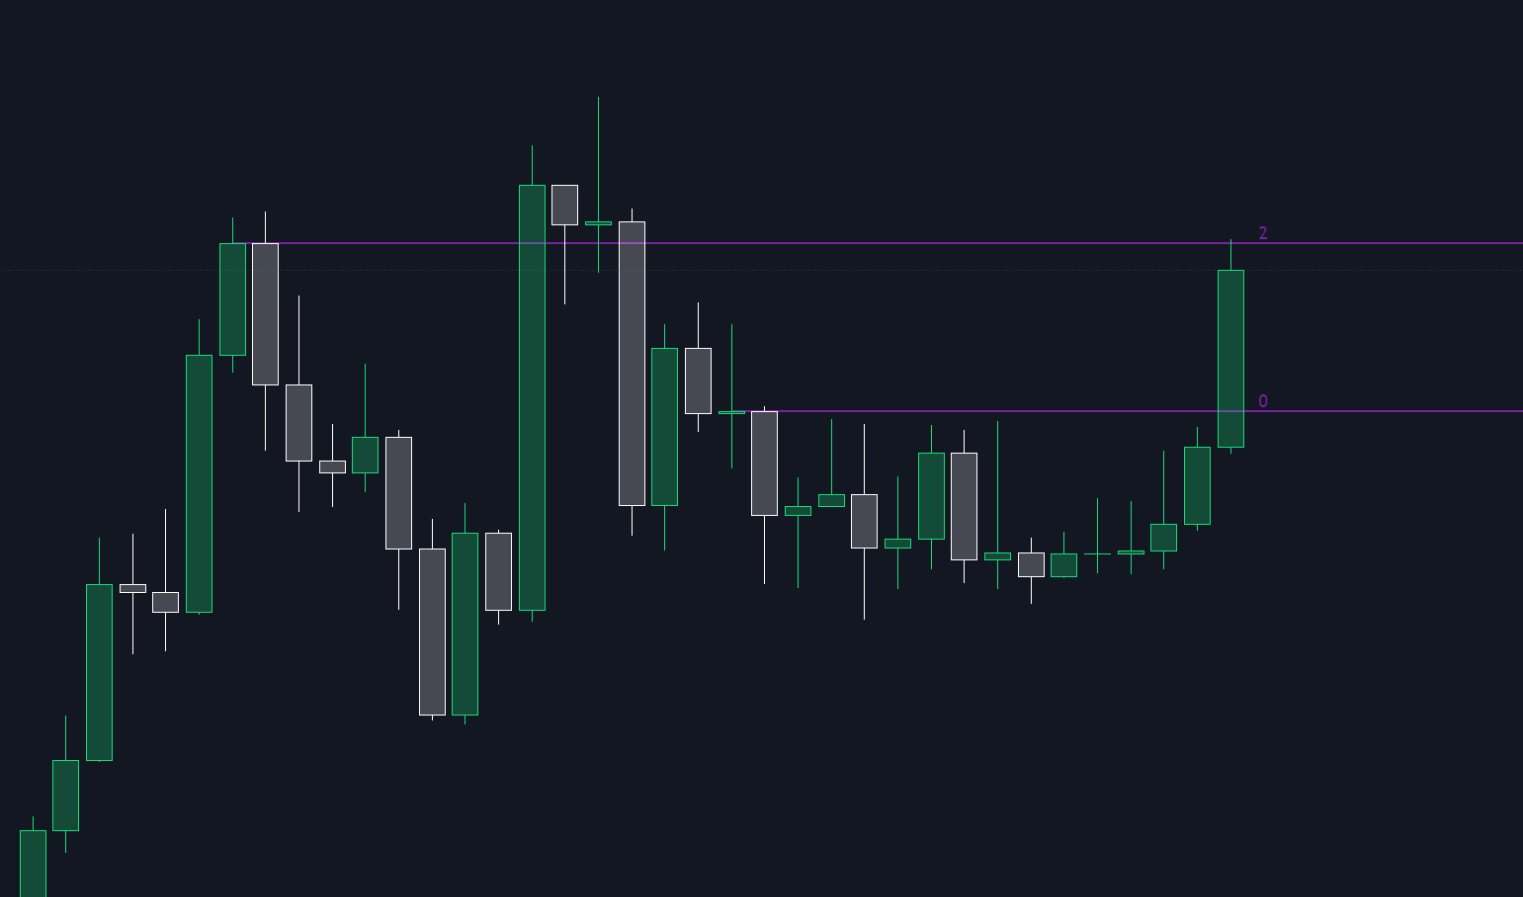
Malaysian SNR - Fixed Range

Time-Range SNR Levels — Precise Support & Resistance
The Malaysian SNR Levels – Fixed Range indicator calculates support and resistance from a user-defined time period instead of a fixed bar lookback. This gives you consistent, timeframe-independent levels based on line chart peaks and valleys.
Key advantages:
- Define your analysis period from obvious accumulation or distribution zones
- Levels stay consistent when switching timeframes
- Precise levels based on Malaysian SnR methodology, not price zones
- Works on all markets and strategies
- Saves hours of manual chart work
119€
Open / Close Trend Change
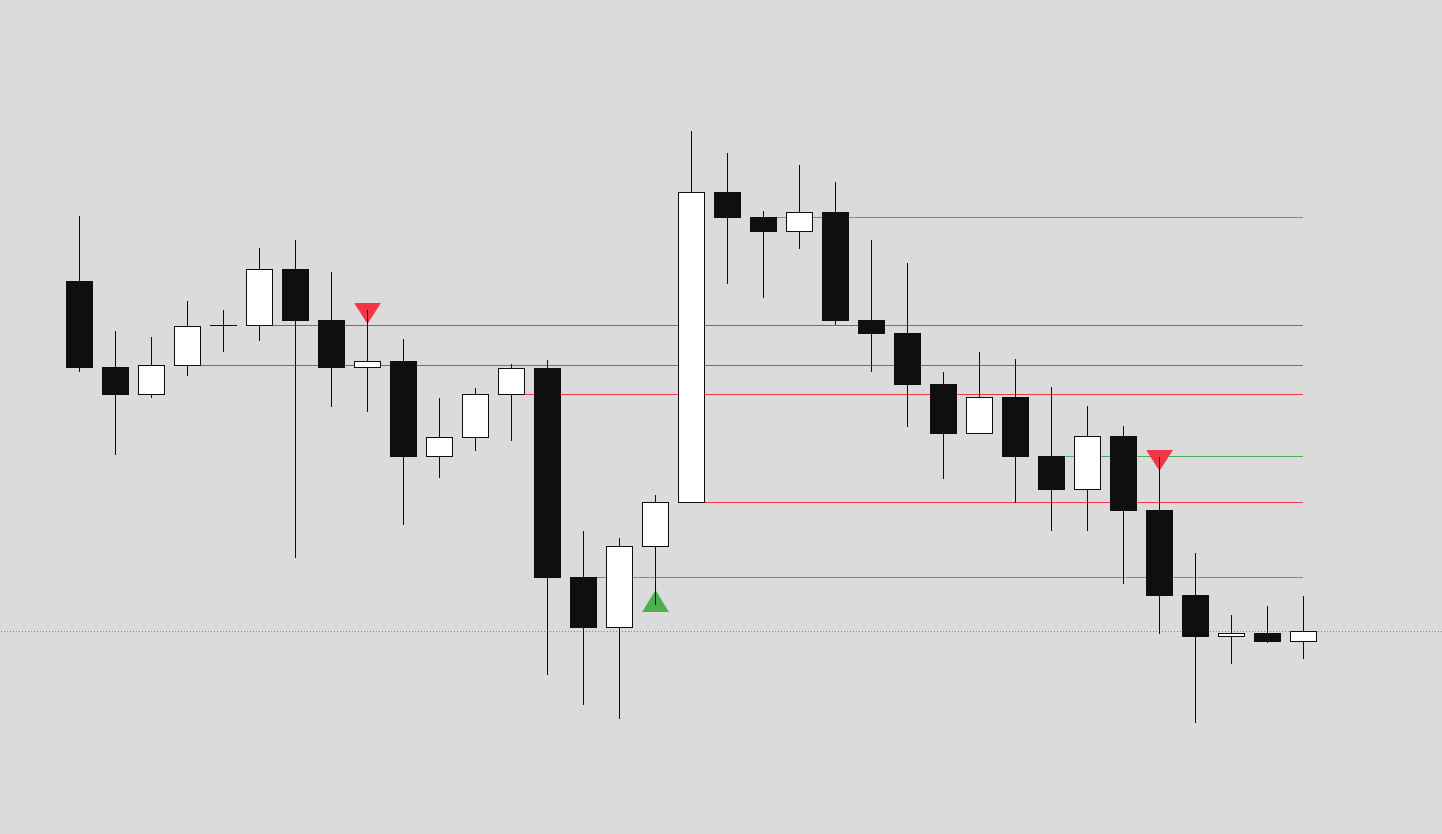
Detects high-probability trend reversal points using a precise 2-candle + confirmation setup based on Close-Open gaps.
The indicator identifies two consecutive candles of the same direction that create a decision gap. When price closes beyond this gap in the opposite direction, it signals a potential trend change.
Key advantages:
- Clean, rule-based reversal detection on candle closure
- Works on any market and timeframe
- See higher-TF reversals on lower-TF charts
- Visual confirmation triangles for highest-probability entries
- Precise gap levels act as dynamic support/resistance
- Fully customizable lookback and display options
99€
Candle Body Direction
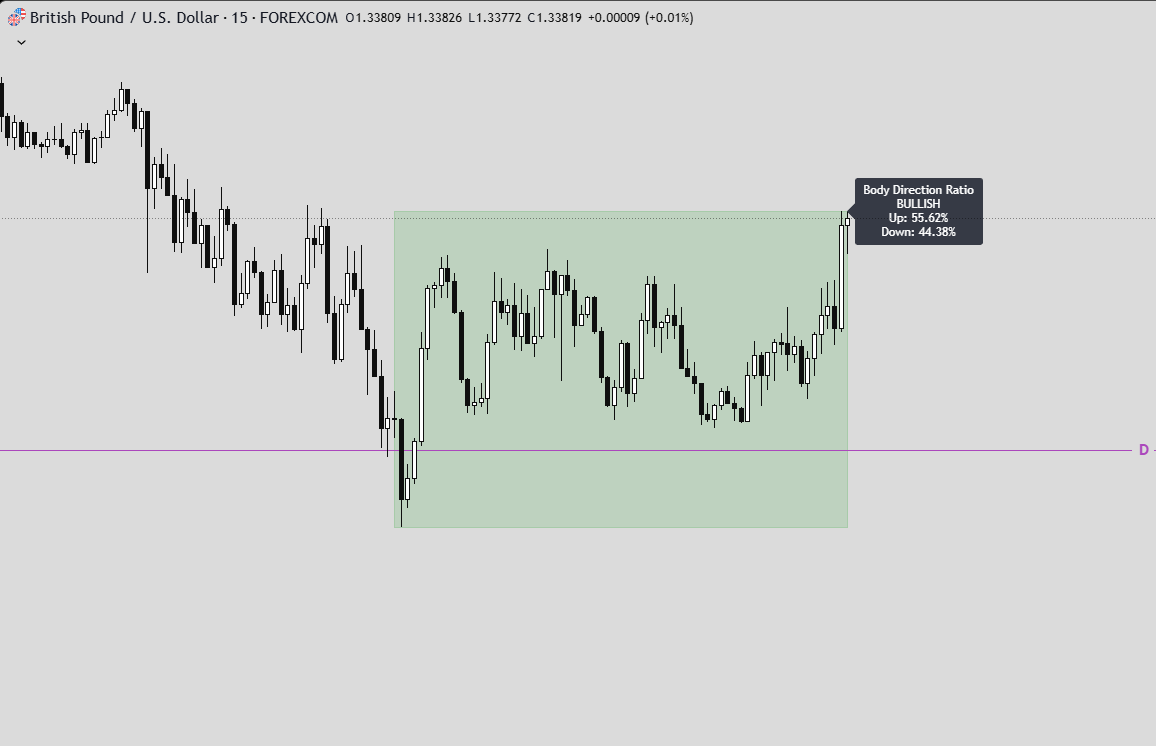
The Candle Body Direction (Fixed Range) indicator measures directional participation inside a user-defined time range by analyzing candle bodies only.
Instead of counting candles, the indicator sums the actual body size of bullish and bearish candles within the selected range and displays their percentage relationship. This provides a clear view of who was in control during that period: buyers or sellers.
What the indicator does
Within the selected time range, the indicator:
- Calculates bullish body size (close > open)
- Calculates bearish body size (open > close)
- Sums both values
- Computes the percentage ratio between bullish and bearish bodies
- Draws a range box covering the high/low of the selected period
- Assigns a Bullish or Bearish bias
- Colors the box automatically based on that bias
89€
CRT - Candle Range Theory
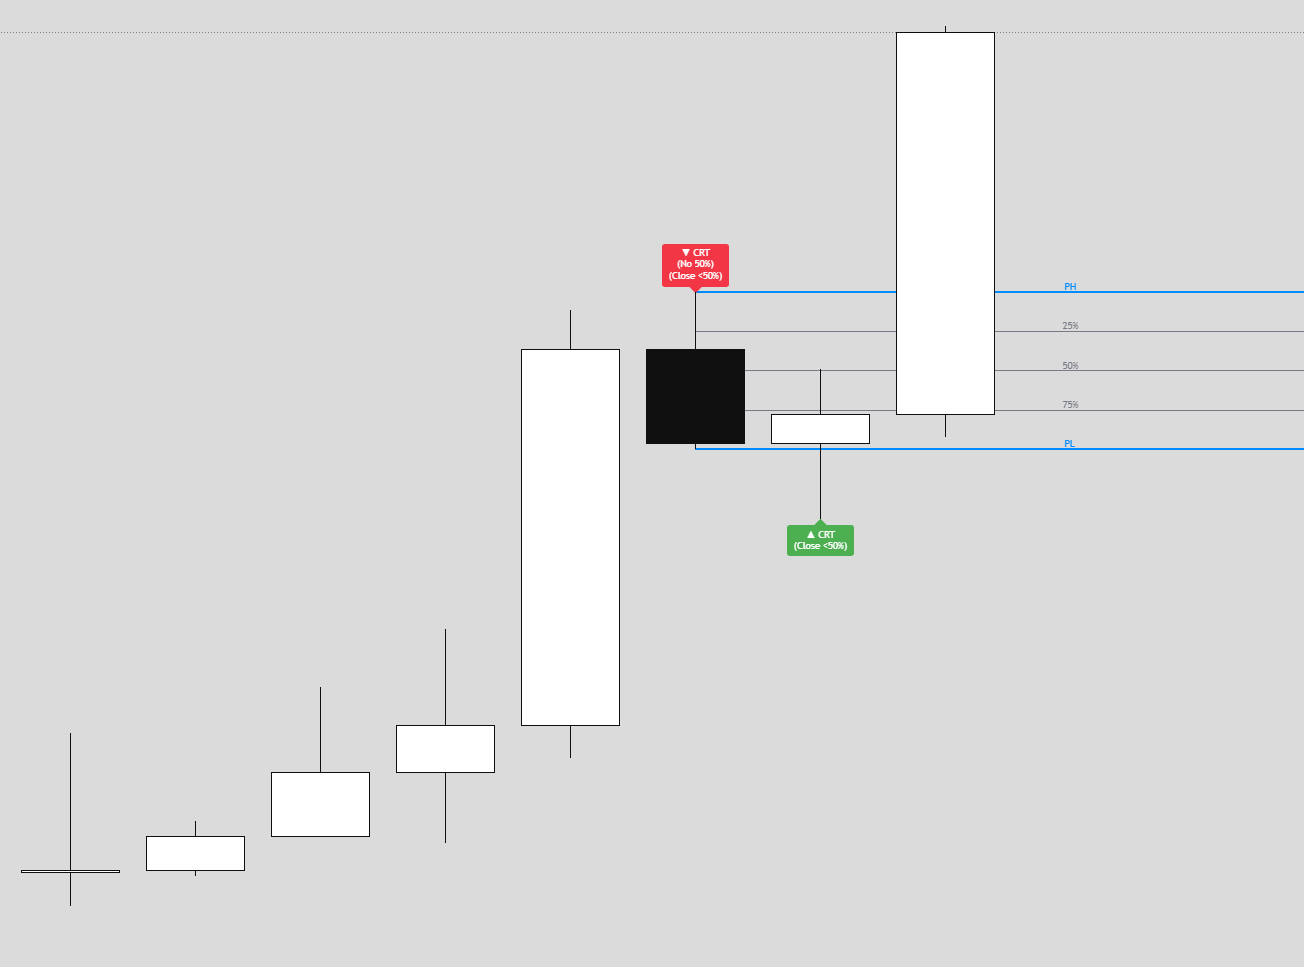
CRT – Candle Range Theory is an indicator that identifies CRT patterns based on the concept of liquidity sweeps and price rejection.
A CRT (Candle Range Theory) pattern occurs when:
- A “Parent” candle establishes a range (High/Low)
- The next candle sweeps beyond one side of that range
- But closes back INSIDE the parent range (rejection)
This creates a potential reversal signal as liquidity has been taken and price rejected continuation.
Alerts
- Close NOT Reach 50%
- Price NOT Reach 50%
- Basic CRT
89€
Market Structure BOS / ChoCh

A comprehensive market structure indicator that identifies Break of Structure (BOS) and Change of Character (CHoCH) patterns on swing and line charts.
KEY FEATURES
- Two detection modes: Swing-based (High/Low) and Line Chart-based (Close)
- Automatic HH/LL/LH/HL labeling with price and percentage change
- BOS (Break of Structure) for trend continuation
- CHoCH (Change of Character) for trend reversals
- Market Structure Candle Coloring (MSC)
- Optional Line Chart overlay
- Fully customizable colors and display options
- Built-in alerts for BOS and CHoCH Alerts.
89€
Malaysian SNR & FVG

This indicator combines the precision of Malaysian SnR levels with Fair Value Gap (FVG) detection, filtering levels to only appear within active FVG zones.
KEY FEATURES
- All features of the Malaysian SNR Levels indicator
- FVGs that invalidate by closing prices (bodies) and wicks.
- Reduced Noise: Instead of showing all nearby levels, only those within institutional imbalance zones are displayed
- Higher Confluence: When a precise SNR level sits inside an FVG, it creates a high-probability reaction zone
- Dynamic Updates: As FVGs get invalidated, the associated levels disappear, keeping your chart clean
- FVGs and MSNR levels an multiple timeframes.
99€
Daily Direction Profile

The indicator helps traders identify the probable direction of the current trading day by detecting breaks of the Previous Day High (PDH) and Previous Day Low (PDL), with a focus on early session breaks.
KEY FEATURES
- Session Boxes – Visualizes three major trading sessions (Asia, London, NY AM) as colored high/low range boxes
- Daily Structure – Tracks the current day’s high and low with horizontal lines, and marks day separators with vertical dashed lines
- PDH/PDL Break Detection – Identifies the first break of the previous day’s high or low
- Time Filter – Optionally limits signals to the first part of the day (configurable, default 12 hours)
- Visual Signals – Triangle markers at the day’s starting bar plus optional break level lines
- Dual EMAs – Fast and slow EMAs for additional trend context
- Alerts – Built-in alert conditions for both PDH and PDL breaks
99€
Daily Bias Volume Profile
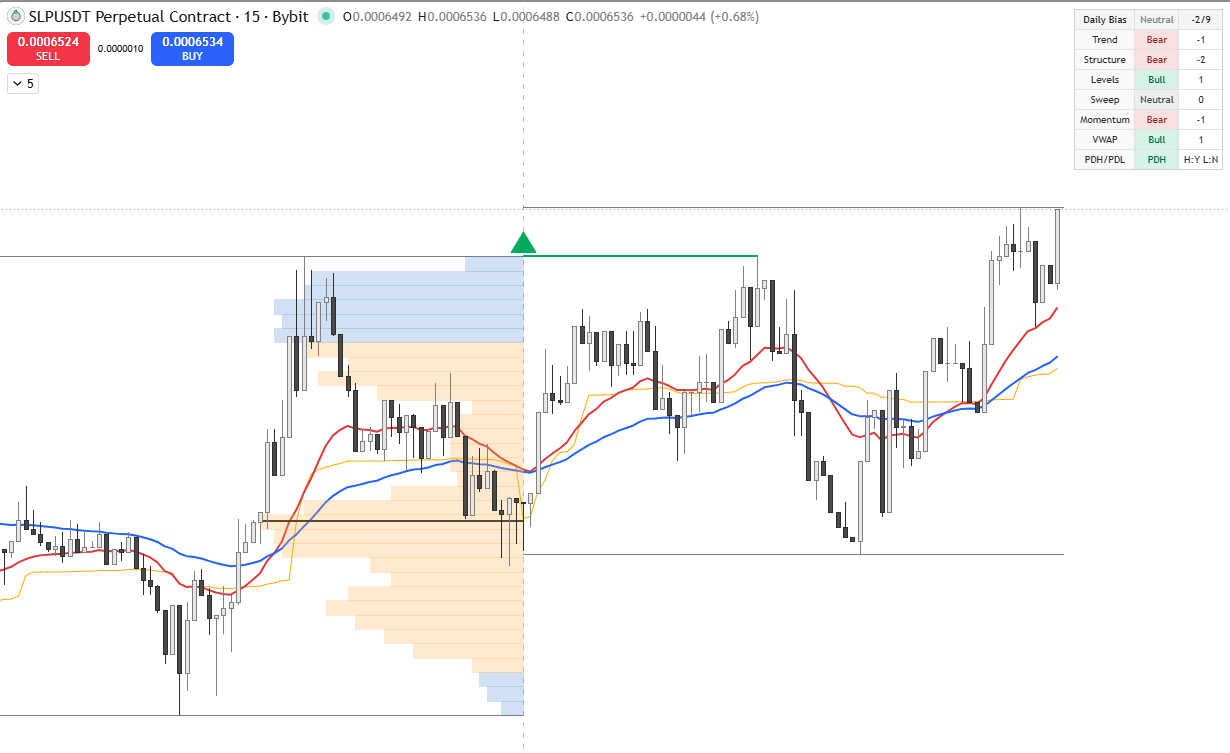
Daily Direction Volume Profile is an intraday context indicator designed to help identify the current daily directional bias while keeping the chart readable.
KEY FEATURES
- Daily bias dashboard with normalized score
- HTF EMA trend bias
- Market structure bias
- Daily/weekly open and PDH/PDL context
- Liquidity sweep/reclaim detection
- Daily momentum filter
- Intraday VWAP filter
- Previous day fixed range Volume Profile approximation
- Previous day POC and value area
- PDH/PDL break status, labels, lines, and alerts
- Daily high/low tracking lines
- Optional EMA and VWAP display
99€
About our Indicators
Our indicators are exclusively developed for TradingView and built according to the highest technical and analytical standards. Each script is carefully designed, tested, and optimized to ensure reliability, performance, and clarity in real trading environments.
After completing your purchase, please send us your TradingView username. Once received, we will manually grant you access to the invite-only indicators directly on TradingView.
Access is usually activated within a short time, and no additional installation is required — the indicators will appear automatically in your TradingView account.
FAQ
How do I purchase an indicator?
You can easily purchase any indicator directly through our website. Just add the indicator to your cart and complete the checkout process. Once the payment is confirmed, you’ll receive an email with further instructions.
What do I need to do after purchasing?
After completing your order, please reply to the confirmation email or send us your TradingView username to info@indivisionx.com.
We need this to grant your account access to the indicator on TradingView.
How and when will I get access?
As soon as we receive your TradingView username, we will activate your access manually. This usually happens within 24 hours (often much faster). You will then see the indicator appear automatically in your TradingView account under Invite-only scripts.
Is the access lifetime?
✅ Yes – your access is lifetime. Once we have granted access to your TradingView account, you can use the indicator forever, with all future updates included.
Do you provide support after the purchase?
Absolutely. If you have any questions or need help using the indicators, you can contact us at any time via info@indivisionx.com. We’re happy to assist you with setup, usage, or trading-related questions.